Sustainability

Automating emission calculation for enterprises for accurate reporting

Overview

As companies increasingly prioritise sustainability, the ability to track and report ESG (Environmental, Social, and Governance) data efficiently is become crucial.

This case study explores the design of a digital platform integrated within Fusion, which seamlessly extracts transaction data, calculates carbon emissions, and presents insights.

The Problem

Companies find it difficult to track and report ESG (Environmental, Social, and Governance) data accurately. Existing methods rely on manual entry and multiple disconnected systems, leading to errors, inefficiencies, and challenges in meeting compliance requirements.

My Role

As a Senior Designer, i was responsible for UX research, wireframing, prototyping, and final UI design. I collaborated closely with product managers, engineering, and ESG domain experts to ensure alignment with business and user needs.

Research

We conducted interviews with sustainability managers and financial analysts. Here are some key insights:

  • High manual effort & Errors: ESG reporting was time-consuming and prone to inconsistencies. Users reported spending up to 40% of their time just cleaning data before they could begin reporting.
  • Lack of standardisation: Data was scattered across different departments, leading to inconsistencies and inefficiencies. One user stated, "We struggle to keep track of all our data points across different departments. Excel is just not designed for this level of complexity."
  • Scalability & Usability Challenges: Excel became increasingly difficult to manage as data scaled, making timely analysis nearly impossible.

  • Need for automation: Users wanted a seamless way to track emissions without complex calculations.

Current Methods

Calculations in Excel
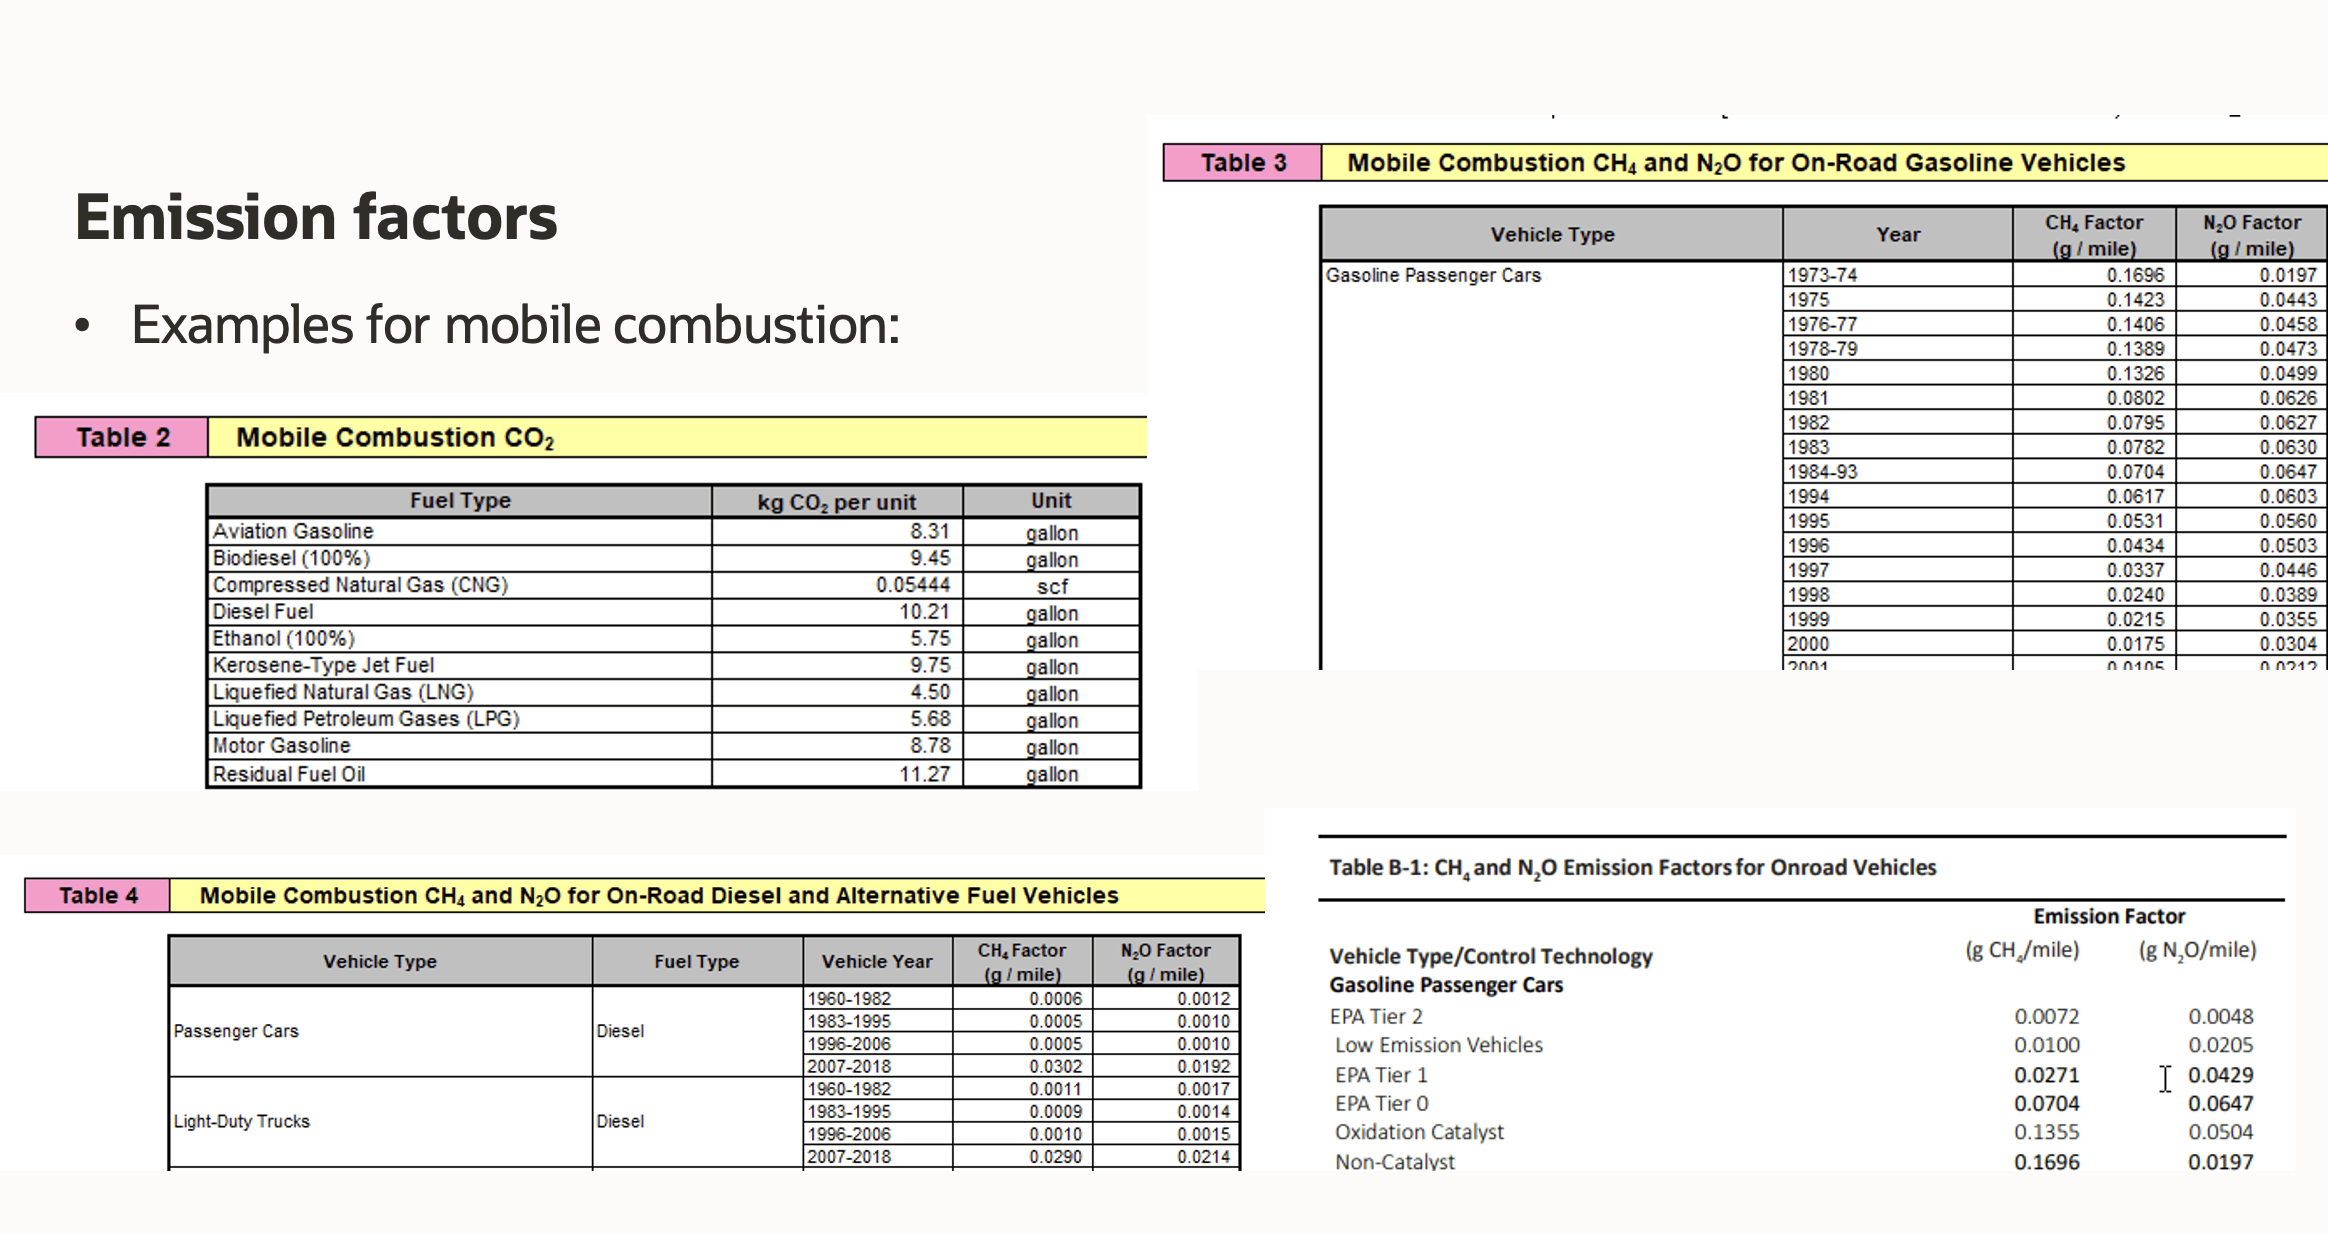
Emission Standards

Design Goal

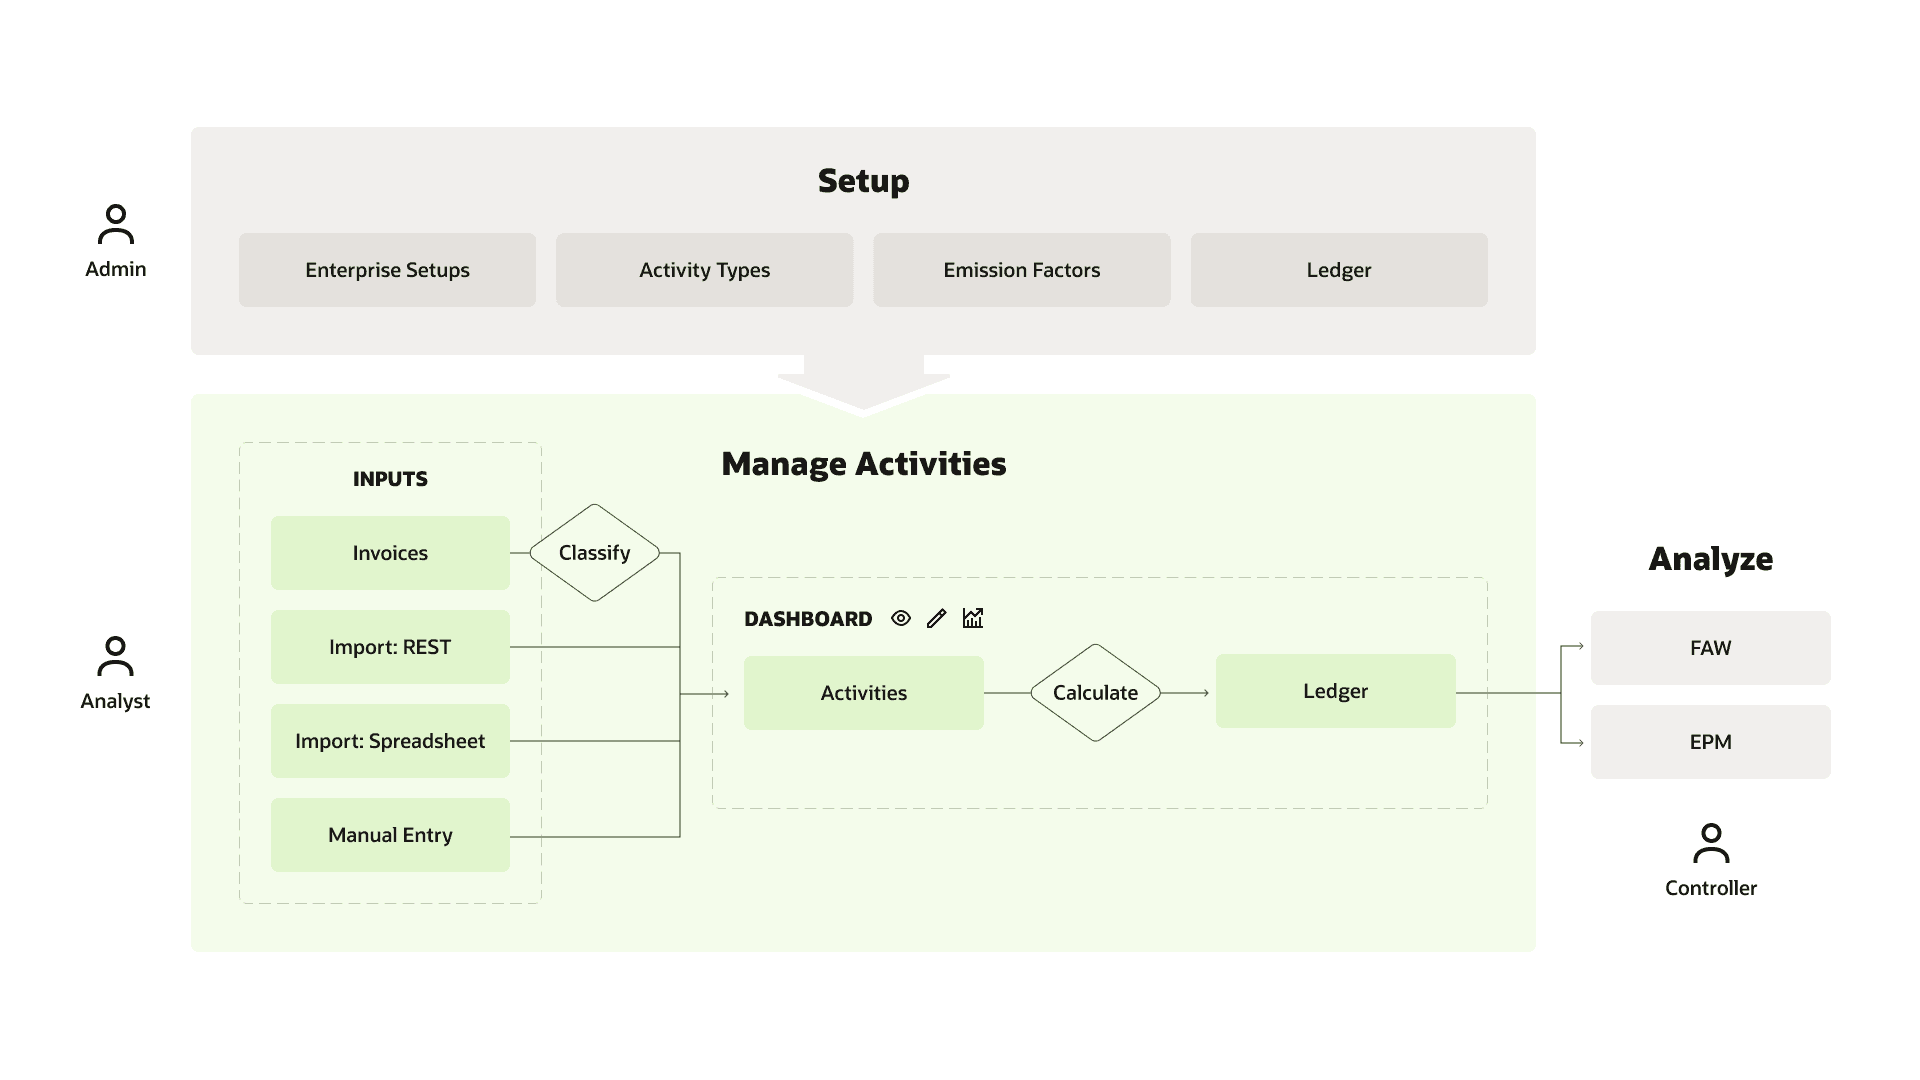
Design an automated emissions tracking platform that integrates with business systems to reduce manual effort, enhance data accuracy, and ensure compliance with regulatory standards.

Explorations

We conducted interviews with sustainability managers and financial analysts. Here are some key insights:

  • Manual Entry Dashboard: Rejected due to inefficiency and high error rates.
  • Manually Import Spreadsheet: can contain inconsistent, duplicate, or missing data, making it difficult to ensure accuracy
  • AI-powered Reporting Tool: Promising but required extensive machine learning training.
  • Fusion-integrated Solution: Chosen for its feasibility, accuracy, and automation capabilities.

Explorations

Final Designs

After several explorations and feedback from customers during user testing here are key designs that digitised and simplified extracting emission data.
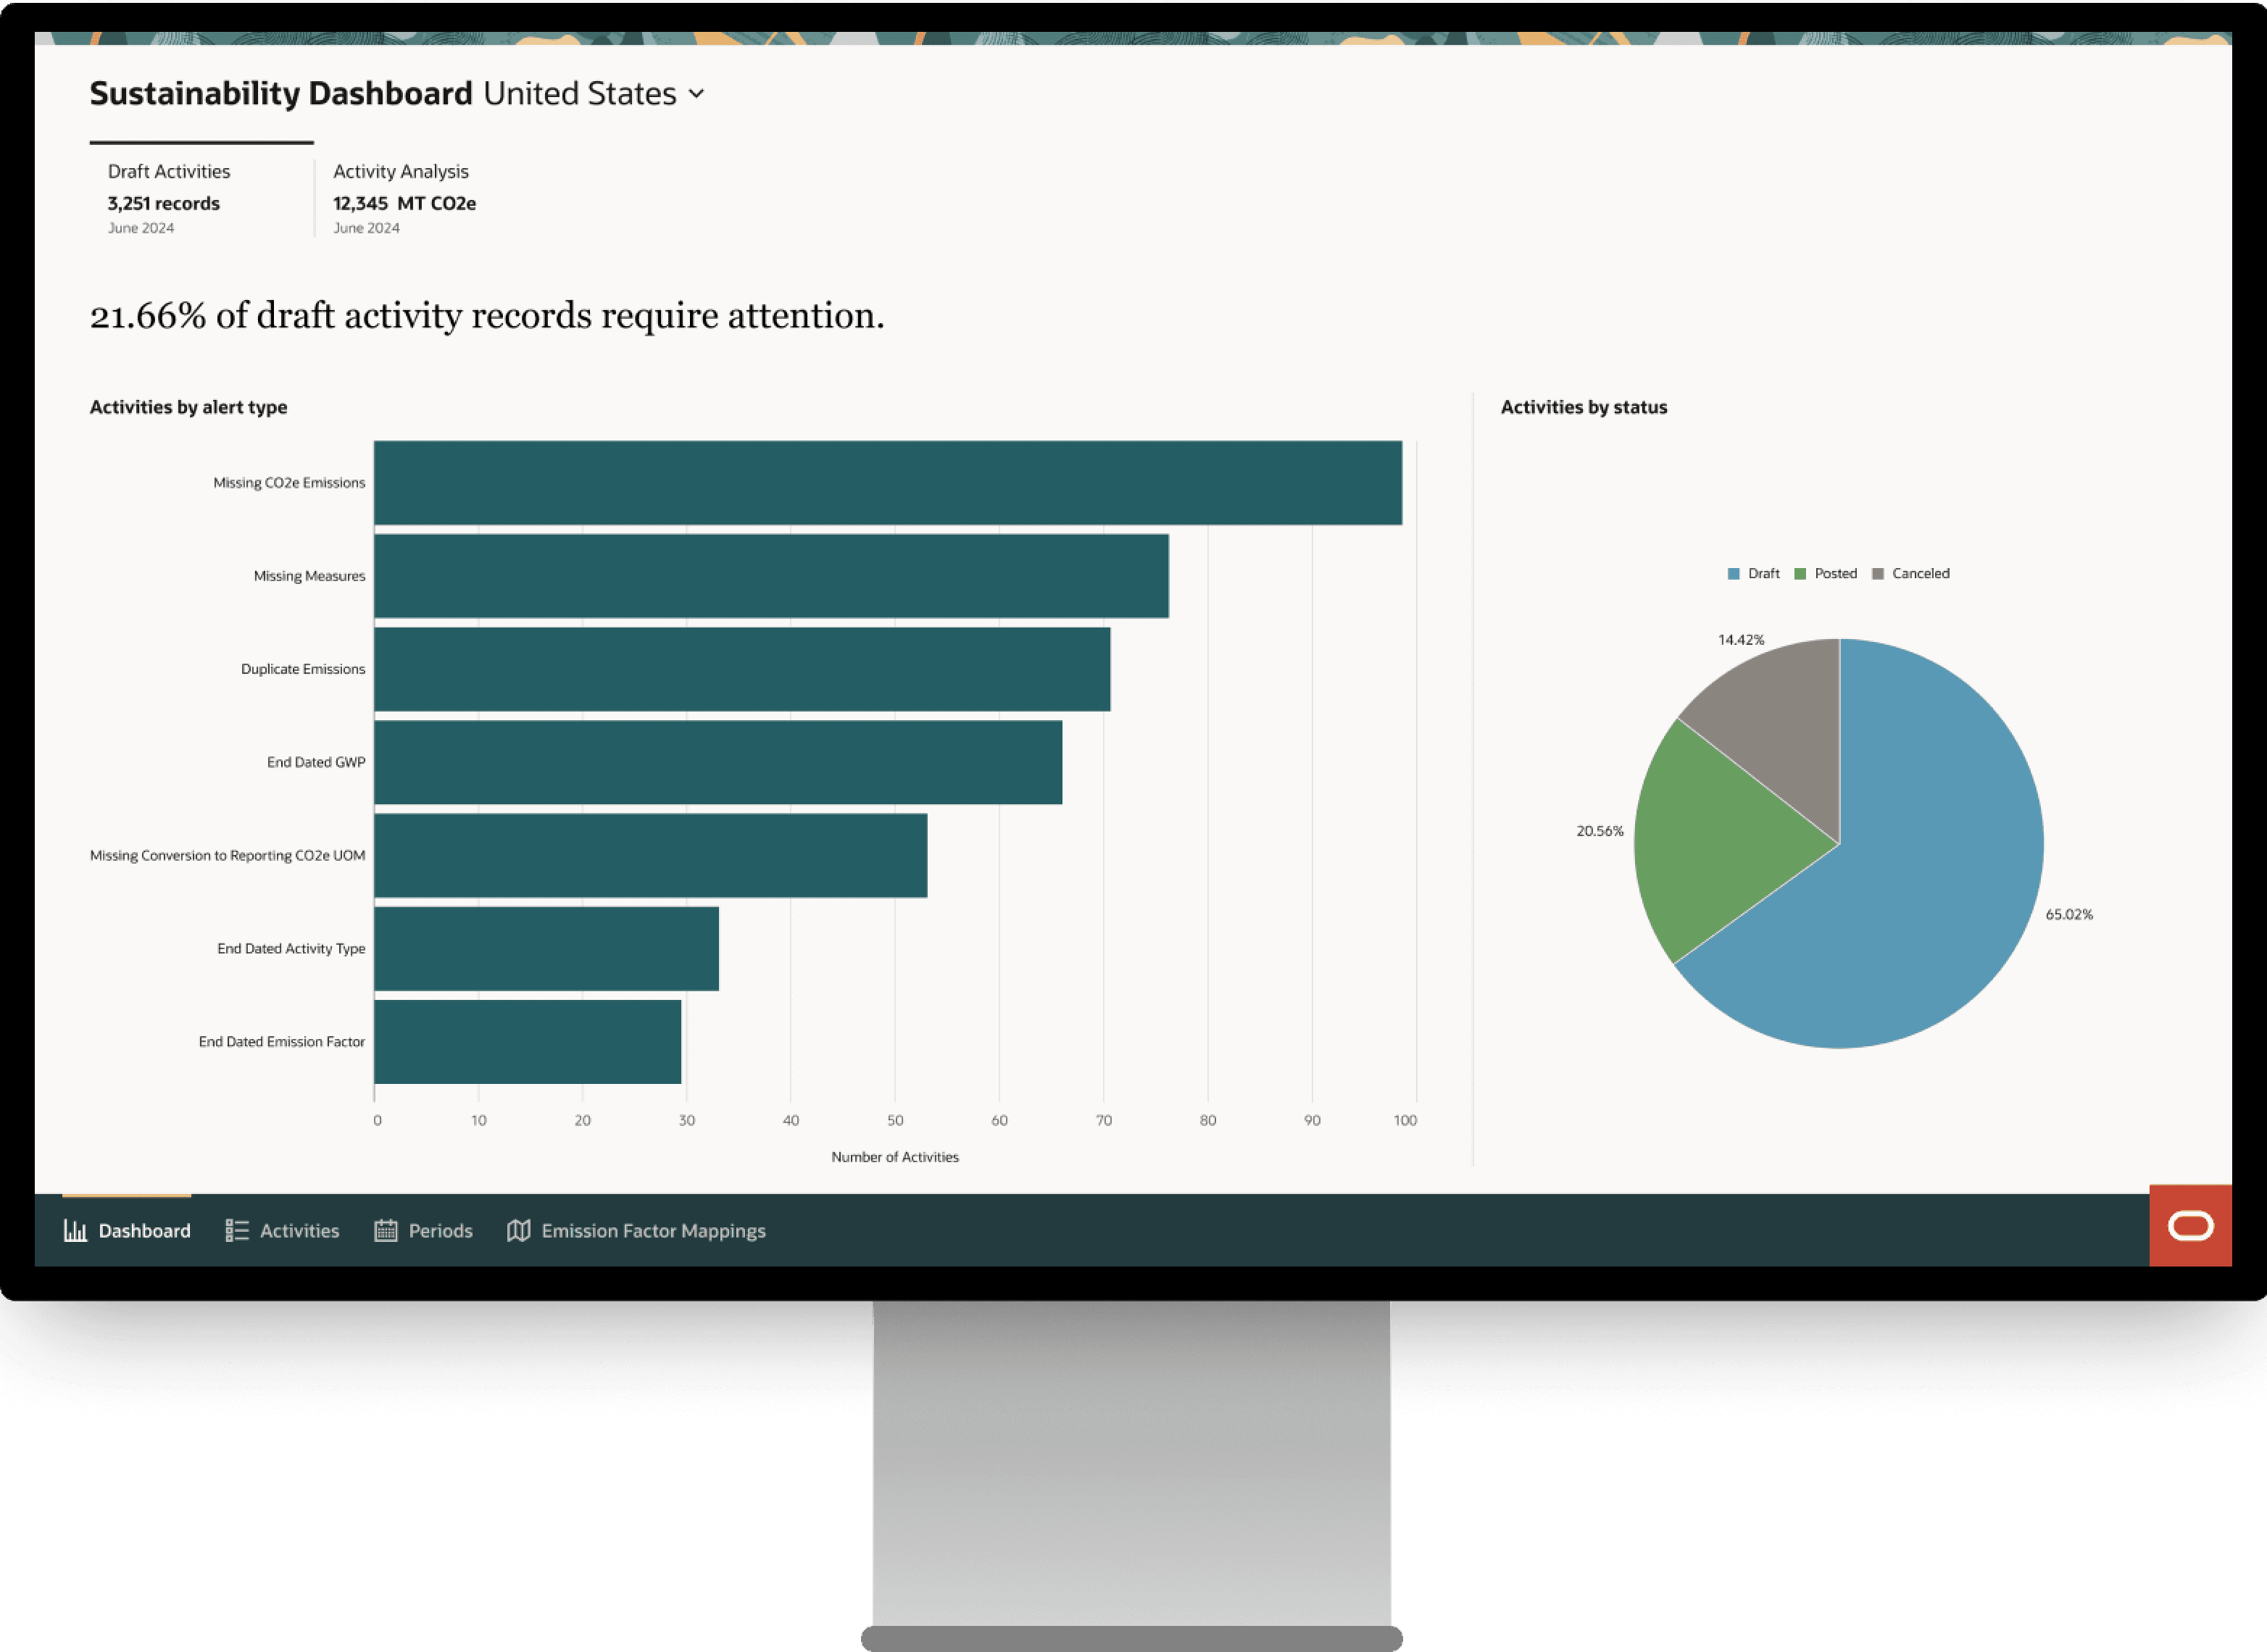
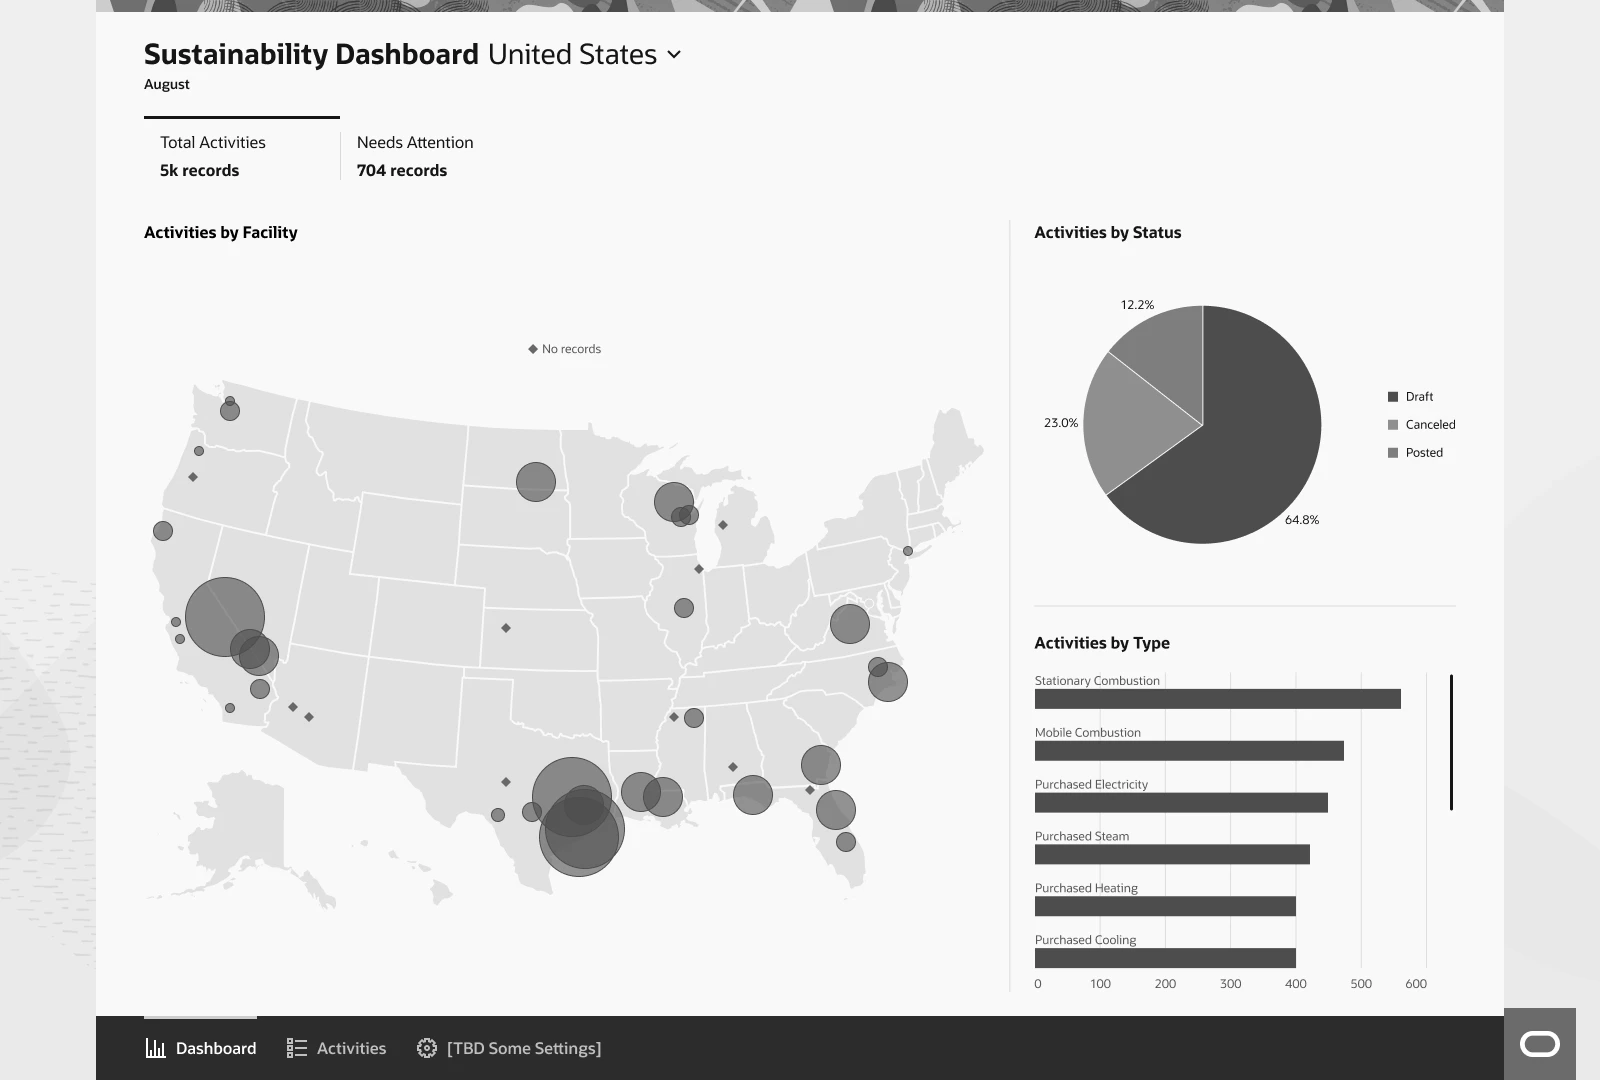
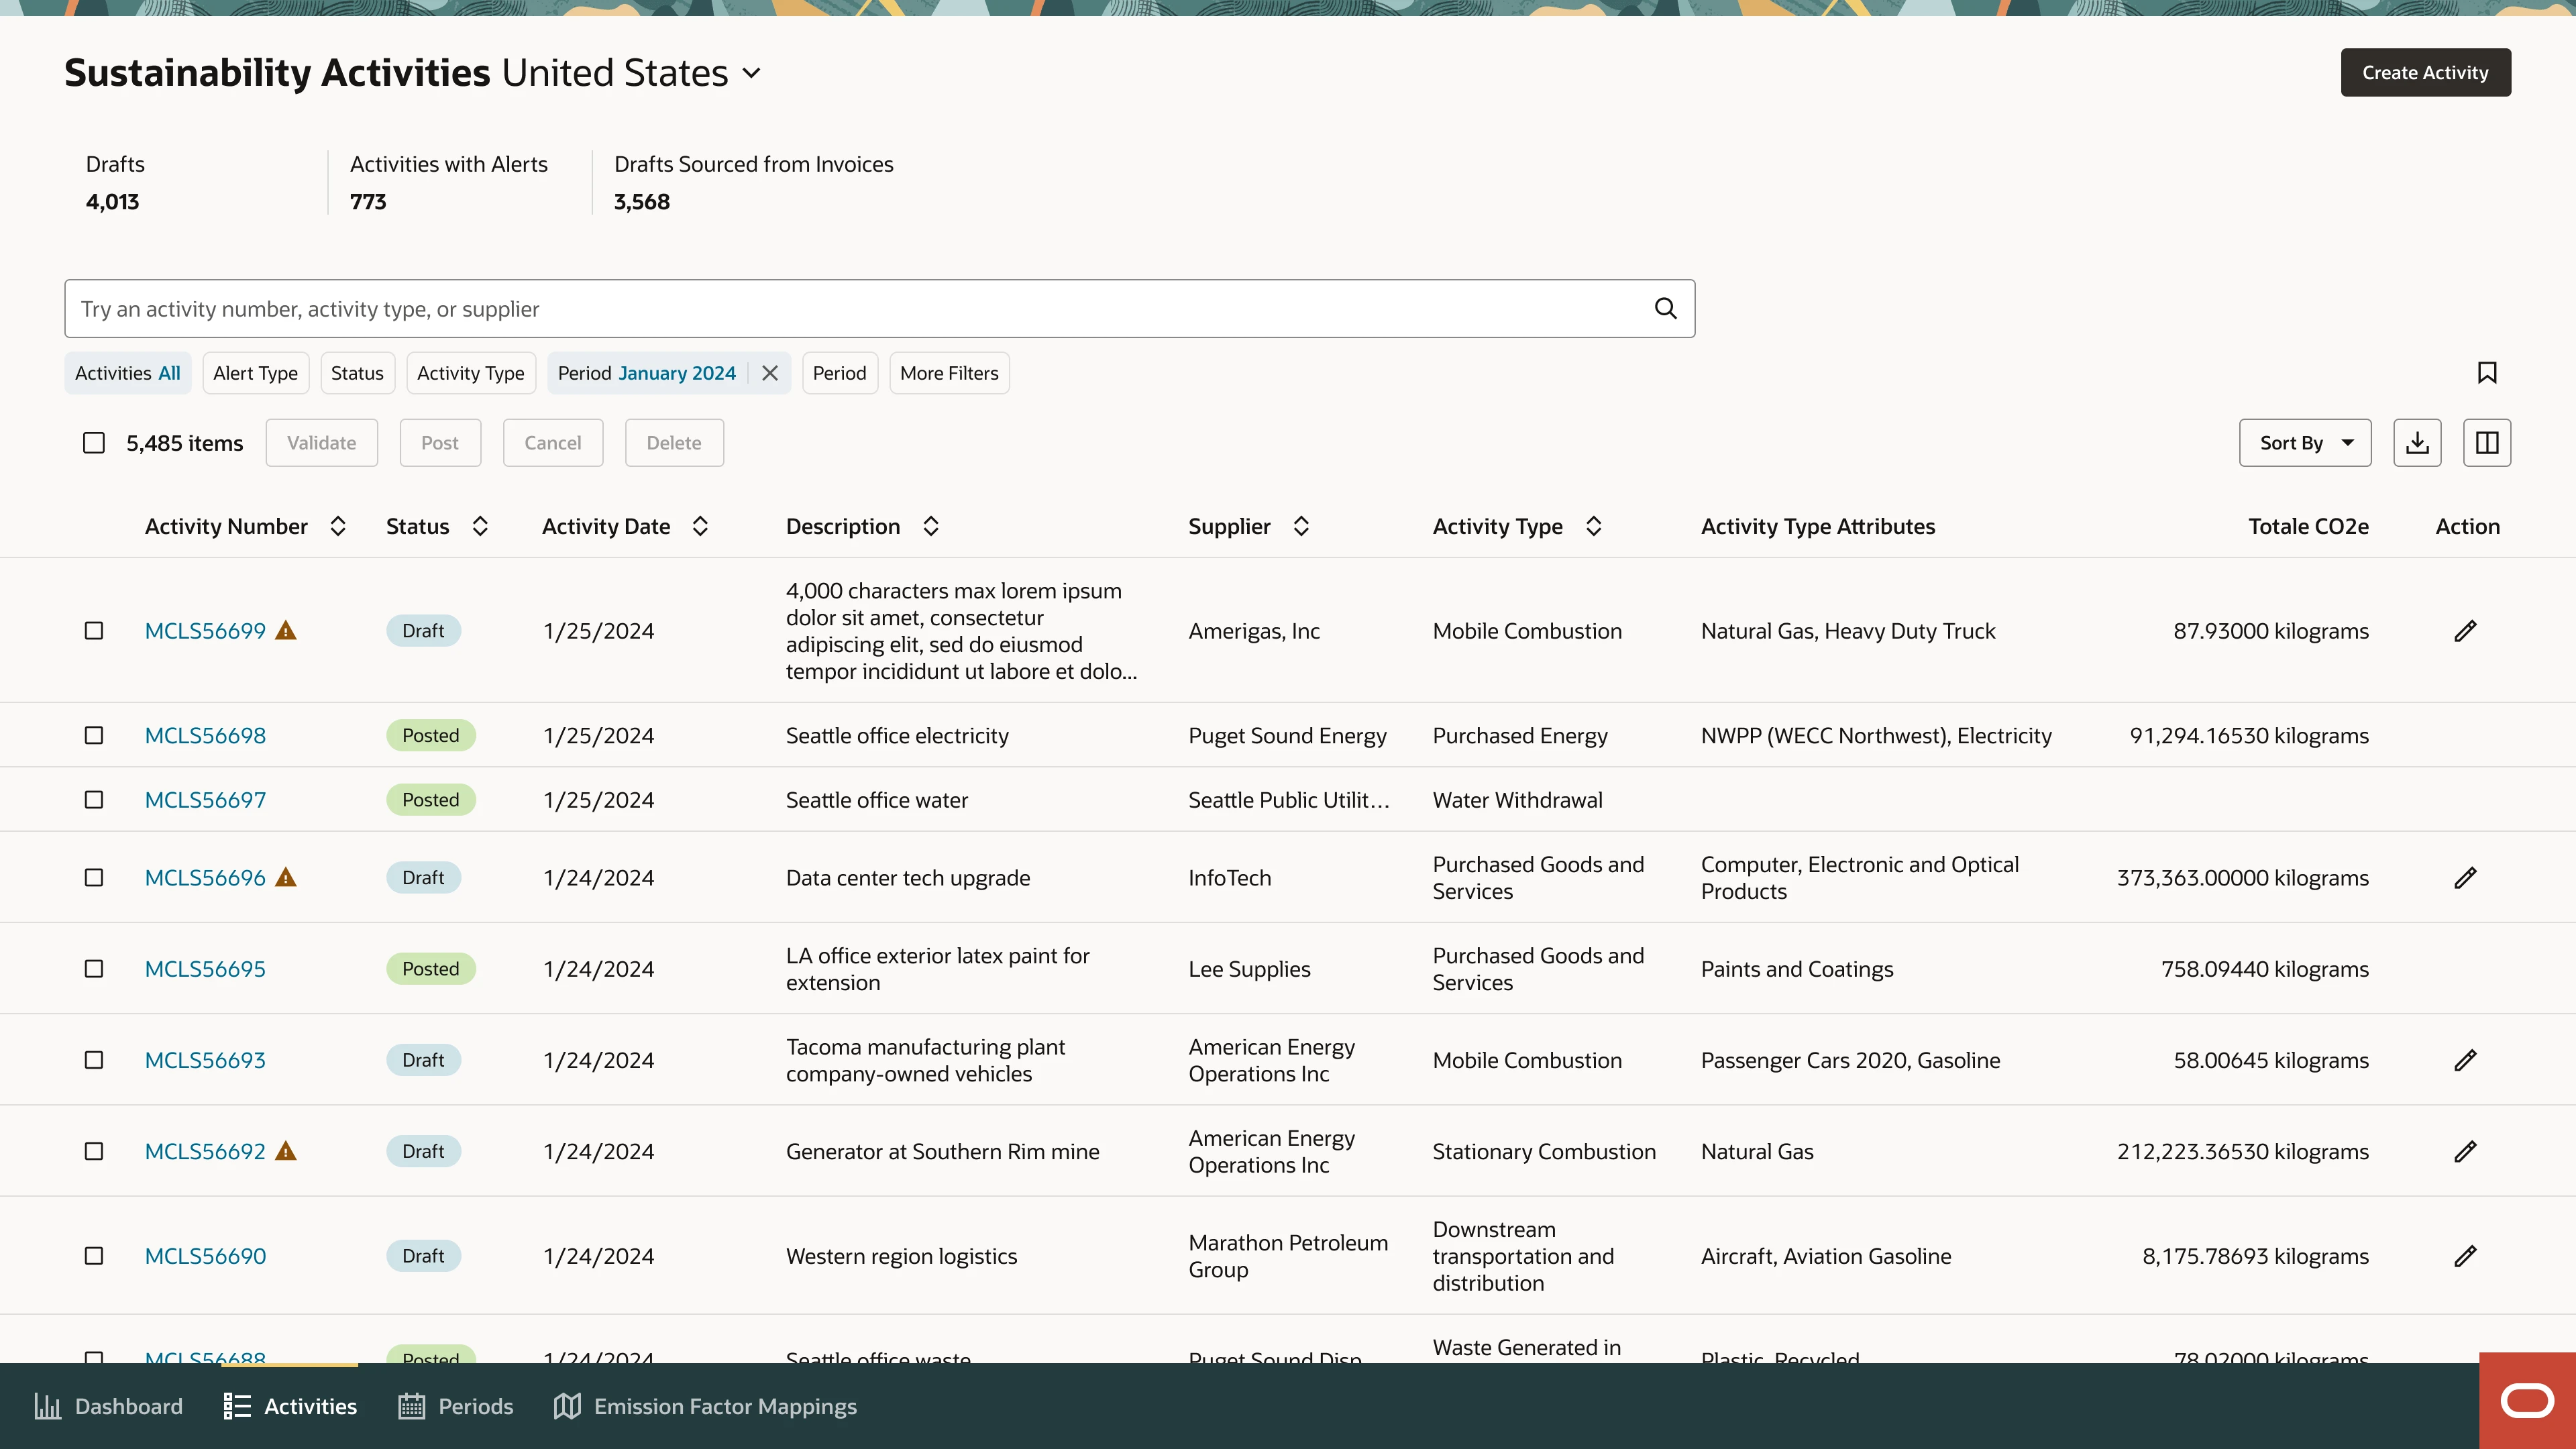
Dashboard

Provides an overview of sustainability reporting activities, highlighting data issues, emissions analysis, and record statuses to help users manage ESG compliance efficiently.

Activities

the Activities tab lists sustainability-related activities extracted from transactions in Fusion applications, calculates their emissions, and displays them in a structured table format for tracking and validation.

Activity Details

A detailed overview of the activity record, including emission calculations, classifications, and sources.

Impact

  • The product's design achieved a 100% conversion rate, successfully replacing the use of Excel spreadsheets among customers.
  • Improved accuracy and efficiency by reducing manual calculation errors, saving time and effort enabling businesses to focus on strategic decision-making instead of data processing

  • The calculation methods and reporting met compliance requirements set by regulatory bodies like SBTi and SEC.
  • Identifying emission hotspots, helping businesses prioritise reduction strategies.

Next Project

Next Project

Mass Replacements

Helping buyers in supply-chain management with bulk item replacements when a supplier fails to provide an item.

View Case Study

Let’s connect.